
How it looks in the platform
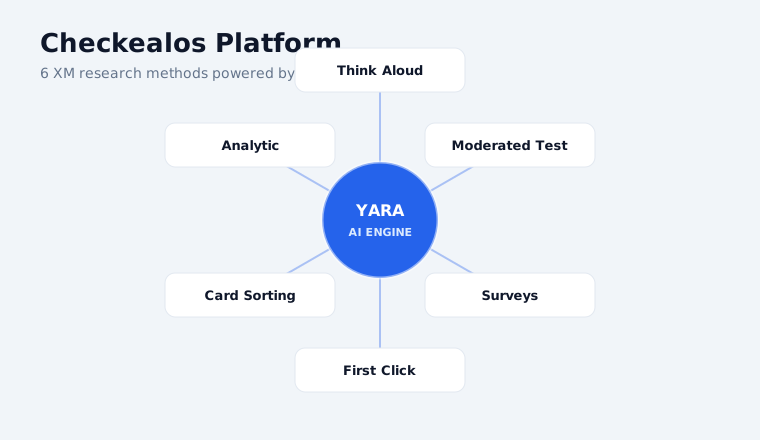
The platform
Studies, panel and analysis in one place.
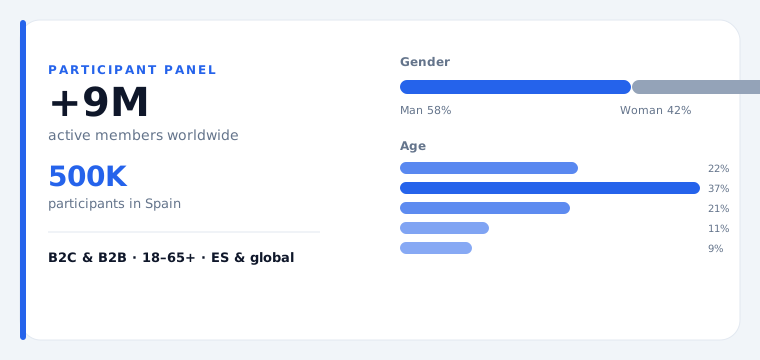
The panel
Qualified testers by country, language and profile.
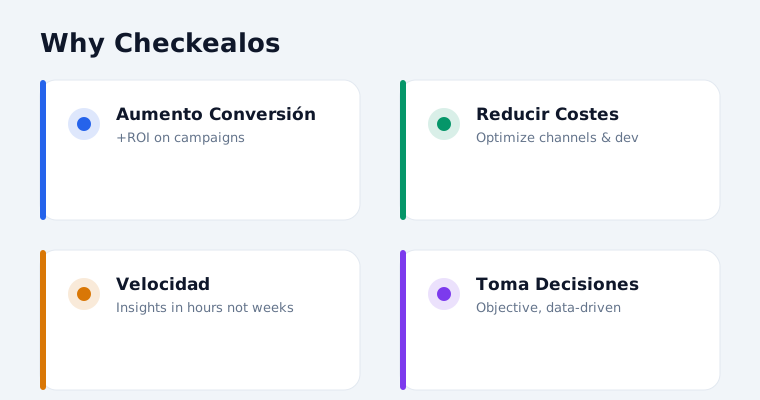
The results
Metrics comparable with your previous studies.
What you will get
METHODOLOGY: First-Click Testing (Visual Hierarchy) DIMENSION: PX (Product Experience) USE CASE: Brand testing DEPARTMENT: Marketing & Brand Advertising ANALYSIS: Statistical analysis + thematic coding OUTPUT: Actionable insights report with prioritized recommendations TEMPLATE: Brand Perception via First-Click Test: Auditoría de Reputación de Marca Empleadora en Glassdoor
What is this template?
Brand Perception via First-Click Test: Auditoría de Reputación de Marca Empleadora en Glassdoor is a comprehensive toolkit for Marketing & Brand Advertising teams addressing brand perception testing. Built on First-Click Testing (Visual Hierarchy) principles, it helps organizations close the gap between current and desired product experience.
Purpose: Provide Marketing & Brand Advertising with a structured First-Click Testing (Visual Hierarchy) framework to evaluate brand perception testing and convert insights into action.
Why it matters in User Experience
In User Experience the rule is simple: what people do matters more than what they say. A study like this observes real behaviour —clicks, hesitation, drop-off— instead of relying on recall or stated intent.
Problem it solves
Disconnected data sources around brand perception testing prevent Marketing & Brand Advertising from seeing the full picture and making informed decisions.
Proposed solution
Integrate Brand Perception via First-Click Test: Auditoría de Reputación de Marca Empleadora en Glassdoor into your Product Experience workflow. Marketing & Brand Advertising gains the ability to benchmark brand perception testing, identify patterns, and act on insights in real time.
Study tasks
-
01
Step 1
Select 5 key screens/stimuli from "Brand Perception via First-Click Test: Auditoría de Reputación de Marca Empleadora en Glassdoor" journey. Cover entry point, core task, and conversion moment for brand perception testing.
-
02
Step 2
Recruit 20–30 participants. Balance by demographic profile and familiarity with brand perception testing context.
-
03
Step 3
Present each stimulus for 5 seconds, then remove. Record first click coordinates. Repeat per screen (randomized order).
-
04
Step 4
Overlay click data on stimuli → heatmaps. Calculate accuracy (% clicks on target) and time-to-first-click.
-
05
Step 5
Compare first-click accuracy across versions (A/B if available). Identify visual hierarchy breakdowns for brand perception testing.
-
06
Step 6
Analyze patterns: where do users click when target is NOT obvious? What draws misdirected attention?
-
07
Step 7
Correlate first-click with task completion rates. Validate that first-click accuracy predicts overall brand perception testing success.
-
08
Step 8
Deliver recommendations: visual hierarchy fixes, CTA placement optimization, attention-flow diagrams per screen.
How to prepare it
Briefing, sample and screening criteria
Briefing
Define the goal in one sentence before touching the template: which decision depends on this study. In Brand Perception via First-Click Test: Auditoría de Reputación de Marca Empleadora en Glassdoor the goal is Provide Marketing & Brand Advertising with a structured First-Click Testing (Visual Hierarchy) framework to evaluate brand perception testing and convert insights into action. That sentence is the filter for everything else.
Muestra
For First-Click Testing (Visual Hierarchy) we recommend 200-400 participants and a duration of 5-10 minutes. In the Checkealos panel we recruit by country, language, device and professional profile, so your sample arrives pre-qualified.
Criterios
Write your screening criteria in positive form (who DOES fit) and negative form (who would contaminate the sample). Add one control question: if the participant fails it, the response stays out of the analysis.
How to analyse it
Metrics and how to read them
Metricas
This study returns: NPS, CSAT, CES, segment breakdown, response rate. Every metric is computed the same way across all First-Click Testing (Visual Hierarchy) studies, so you can compare against your own history and against sector benchmarks.
Interpretar
Never read one metric in isolation: cross success with time and with perceived effort. High success with high effort means a flow that works only through sheer user stubbornness; low success with short times usually means an expectation problem, not a design problem.
Best practice and common mistakes
Best practice
- Run a pilot with 3-5 participants before opening the full sample.
- Write tasks as goals, not instructions (“get the receipt”, not “click the blue button”).
- Record a baseline metric before the change so you can measure the improvement.
- Keep the verbatim quotes: those are the ones that convince a board.
- Close the loop: share what changed after the study.
Common mistakes
- Asking for opinion instead of measuring behaviour.
- Recruiting colleagues as if they were real users.
- Changing several things at once and not knowing what worked.
- Leaving the sample open “until we have enough” and mixing waves.
- Shipping the report without a decision assigned to each finding.
Sample tasks and questions
Ready-to-copy examples for your study
Example 1
Select 5 key screens/stimuli from "Brand Perception via First-Click Test: Auditoría de Reputación de Marca Empleadora en Glassdoor" journey. Cover entry point, core task, and conversion moment for brand perception testing.
Example 2
Recruit 20–30 participants. Balance by demographic profile and familiarity with brand perception testing context.
Example 3
Present each stimulus for 5 seconds, then remove. Record first click coordinates. Repeat per screen (randomized order).
Example 4
Overlay click data on stimuli → heatmaps. Calculate accuracy (% clicks on target) and time-to-first-click.
Use cases by department
Who uses this template inside the company
Marketing & Brand Advertising
Brand testing
Product
Brand testing
Design
Brand testing
Engineering
Brand testing
Marketing
Brand testing
Cause & effect analysis
Cause: Lack of systematic measurement of brand perception testing. Effect: Marketing & Brand Advertising makes decisions without evidence, leading to poor Product Experience outcomes and wasted investment.
Template data
Dimension
User Experience (UX)
Methodology
First-Click Testing (Visual Hierarchy)
Use case
Brand testing
Department
Marketing & Brand Advertising
Category
CORE01: Strategic Foresight & Market Sensing
What this template includes
Excel template
The study pre-built: tasks, screening criteria and metrics, ready to edit.
Session script
Instructions and script for the participant, aligned with the methodology.
Analysis template
Results dump with metrics computed and comparable.
Recruitment
Access to the tester panel by country, language and profile.
Related templates
Card Sort: Product Concept Testing — Idea Validation
Measuring Student Experience with University Instructor Evaluation Form (Survey)
Optimizing Idea Validation: Concept Study: Video (Usability Test)
Measuring Digital Feedback with Card Sorting (Open) (Usability Test)
Interview: Diverse and inclusive perspectives: education status — Student Experience
Frequently asked questions
How many participants do I need?
For First-Click Testing (Visual Hierarchy) we recommend 200-400 participants. That is the point where the signal stabilises without inflating cost.
How long does the study take?
The session lasts 5-10 minutes per participant. Recruitment and field closure usually complete within 48-72 hours.
Can I use my own panel?
Yes. You can invite your own base or use the managed Checkealos panel; the template and the metrics are identical either way.
Which metrics will I get?
NPS, CSAT, CES, segment breakdown, response rate. They are computed automatically and stay comparable with your previous studies.
Do I need a prototype or is the live product fine?
Both work. For First-Click Testing (Visual Hierarchy) what matters is that the participant can complete the task unassisted, in prototype or in production.
How does this fit the six dimensions?
This study sits in User Experience. Results feed the same data model as the other dimensions, so they can be crossed with what happens elsewhere.
Customise and launch this template
Edit the fields for your case and send it: we start recruitment.
Shall we run this study with your panel?
Download the template, adjust it and we will launch it with qualified testers.
Request a Demo